Best AI Anomaly Detection Tools 2026 - 5 Compared
Dynatrace, Datadog, Elastic, New Relic, and Anodot compared on anomaly detection accuracy, pricing, and real-world trade-offs for SRE and DevOps teams in 2026.

Anomaly detection used to mean setting thresholds and waiting for pages. Modern AI-powered platforms have changed that model substantially - they baseline automatically, correlate across thousands of metrics, and aim to distinguish real incidents from noise before your on-call engineer is even awake. The gap between tools has widened too. Choosing the wrong one means either drowning in false positives or missing actual outages.
TL;DR
- Dynatrace Davis AI is the best pick for full-stack causal analysis - it traces root cause through service topologies automatically, no manual rule-writing required.
- New Relic offers the most accessible free tier (100 GB/month) with anomaly detection included in Standard, making it the budget-friendly entry point for smaller teams.
- The key differentiator across all five platforms is whether you need infrastructure/SRE observability (Dynatrace, Datadog, Elastic, New Relic) or business metric monitoring (Anodot) - these are distinct use cases and the wrong tool for your use case will frustrate you regardless of its score.
I benchmarked these five platforms across detection accuracy, setup complexity, false positive rates, and pricing. Each has a genuine reason to exist; none is a clear winner across all dimensions.
What Makes Anomaly Detection "AI-Powered"
Before comparing tools, it helps to understand the underlying approaches, because marketing language is loose here. Three distinct methodologies show up across these platforms:
Statistical baselines - z-score, interquartile range, or simple moving averages. Fast and interpretable but brittle on seasonal data and high-cardinality metrics. Most platforms have moved beyond this as the primary engine.
Time-series forecasting models - Prophet, ARIMA, or ensemble variants. These handle weekly seasonality and trend decomposition well but require longer warm-up periods (usually two to six weeks of historical data) before detection is reliable.
Causal AI with topology mapping - The most sophisticated approach, currently most mature in Dynatrace. Rather than flagging individual metrics, it models dependencies between services and identifies root causes in the actual service graph rather than just flagging symptoms.
Understanding which approach a platform uses tells you more about its real capabilities than any marketing claim.
The Five Tools Compared
Dynatrace Davis AI
Dynatrace's Davis AI engine is the most technically differentiated offering in this comparison. It uses a deterministic causal AI approach - the same fault-tree analysis methodology used by NASA and the FAA - rather than purely probabilistic anomaly scoring. Davis maps your entire service topology through Smartscape (Dynatrace's automatic dependency discovery), then traces anomalies through that topology to identify actual root causes rather than just correlating metrics.
The practical result is an alert noise reduction of up to 90% compared to traditional threshold-based alerting, according to Dynatrace's own documentation. Independent engineering teams I have spoken to confirm that the Davis alert-to-incident ratio is materially better than Datadog or Elastic for complex microservices environments.
The trade-off is cost and complexity. Dynatrace uses consumption-based pricing - the DPS (Dynatrace Platform Subscription) model - billed in host units and Davis Data Units (DDUs). Full-stack monitoring starts at approximately $0.08/hour per 8 GiB host, which scales quickly in large deployments. A 15-day free trial is available with full platform access, plus a permanent free tier for up to three hosts.
Dynatrace is also exclusively an infrastructure and application observability platform. If you need to monitor business KPIs - revenue metrics, conversion rates, or product analytics - Davis won't help you there.
For SRE teams operating distributed systems at scale, it's the strongest pick for autonomous root cause detection. For everyone else, the pricing and the infrastructure-first focus may not fit.
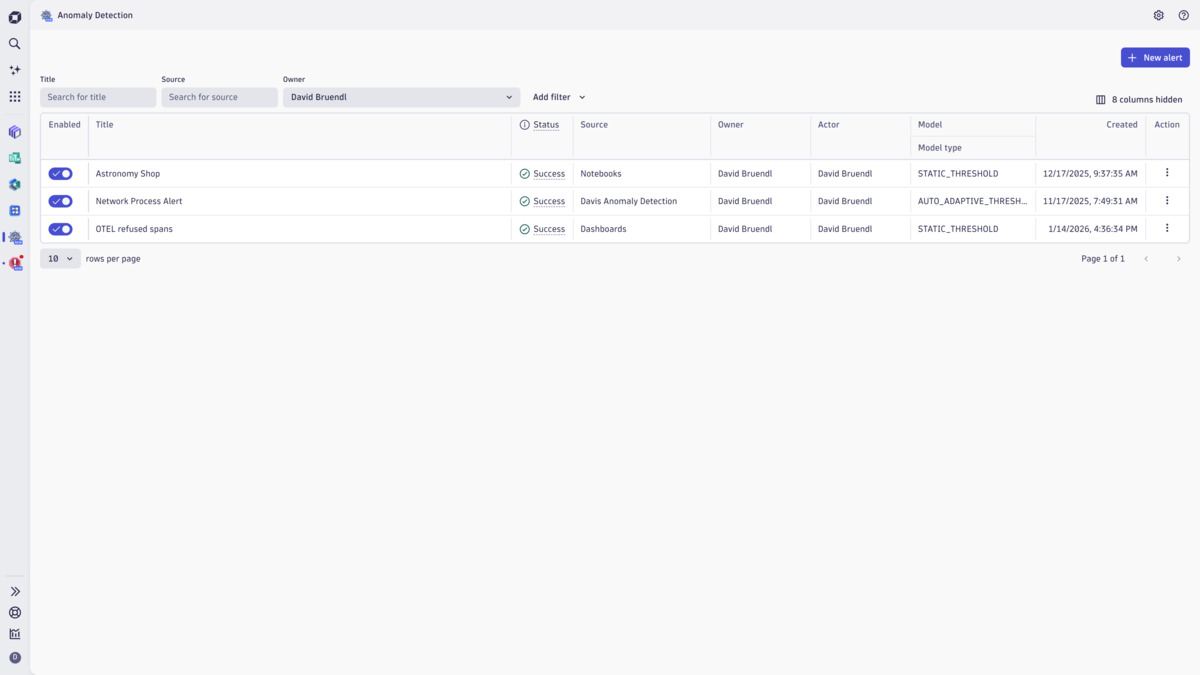 The Dynatrace Davis AI Anomaly Detection app provides a unified overview of all configured detectors, their status, and detection model types in a single view.
Source: dynatrace.com
The Dynatrace Davis AI Anomaly Detection app provides a unified overview of all configured detectors, their status, and detection model types in a single view.
Source: dynatrace.com
Datadog Watchdog
Datadog Watchdog is the anomaly detection engine embedded in the broader Datadog platform. It processes billions of events to establish behavioral baselines, uses two weeks of historical data for initial baseline training, and reaches full effectiveness after roughly six weeks. Watchdog offers three detection algorithms - Basic, Agile, and Robust - giving you some flexibility for environments with high variability.
The integration breadth is hard to match: 500+ integrations out of the box, comprehensive coverage across cloud services, databases, web servers, and SaaS tools. For teams already using Datadog for full-stack monitoring, enabling Watchdog adds zero new infrastructure and minimal configuration.
Pricing is where Datadog becomes a pain point. The modular, usage-based model starts at $15/host/month for infrastructure monitoring and $31/host/month for APM. Enterprise tier, which includes AI-powered anomaly detection and root cause analysis for APM, is required for the most advanced features. Mid-market deployments normally land between $50K and $150K annually; large deployments exceed $500K. New pricing for LLM Observability takes effect May 1, 2026, signaling ongoing pricing changes to watch.
Watchdog is a solid, well-integrated option for existing Datadog customers. Evaluating Datadog purely for anomaly detection is hard to justify given the cost structure.
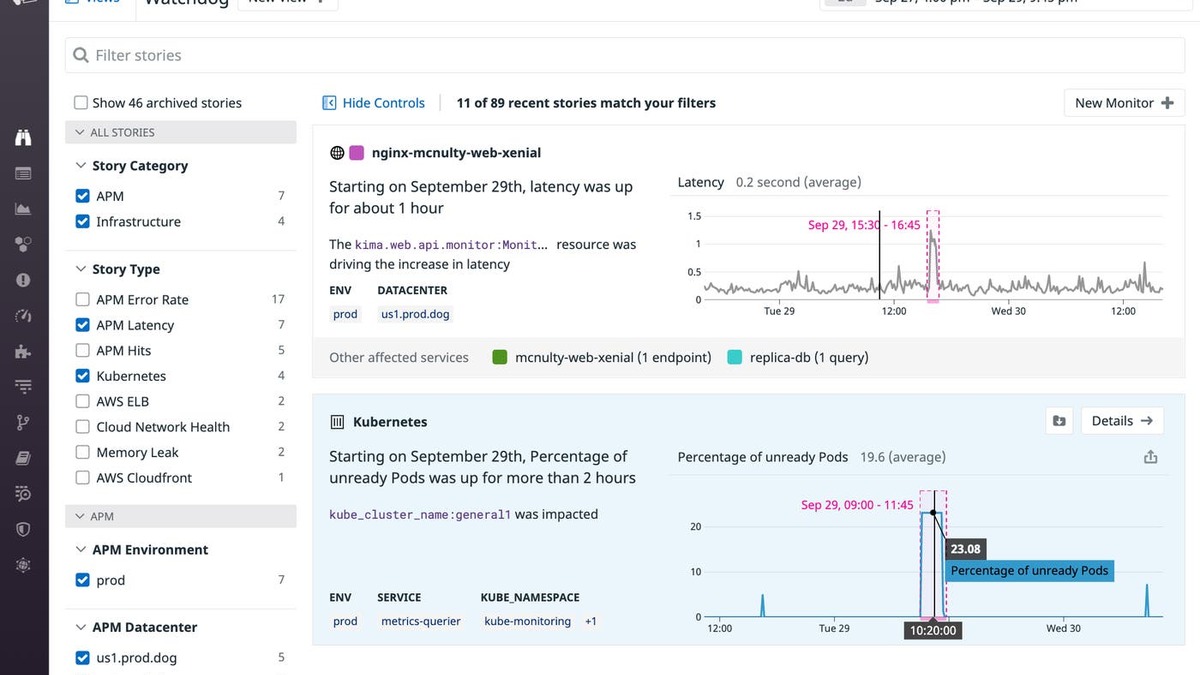 Datadog Watchdog surfaces correlated anomaly stories, grouping related signals across services with dependency maps so engineers can navigate from symptom to probable cause faster.
Source: datadoghq.com
Datadog Watchdog surfaces correlated anomaly stories, grouping related signals across services with dependency maps so engineers can navigate from symptom to probable cause faster.
Source: datadoghq.com
Elastic Observability (ML Jobs)
Elastic's machine learning anomaly detection lives inside Elastic Observability and is unlocked at the Platinum tier ($125+/month starting price) or Enterprise tier ($184+/month). The platform ships with 100+ preconfigured ML jobs covering standard infrastructure and application patterns - no setup required for common use cases. For custom scenarios, guided job configuration wizards walk you through model selection and training.
The technical foundation is strong: unsupervised ML for logs and metrics, influencer field analysis to identify which dimensions are driving anomalies, and seasonal pattern detection. Elastic's documentation claims MTTR reductions of 50% to 70% in real-world deployments using the AI Assistant with automated anomaly insights.
The integration story is also compelling for teams already running ELK Stack: any data indexed in Elasticsearch becomes available for anomaly detection, and Beats/Logstash pipelines require no reconfiguration. Kubernetes dashboards and service maps integrate natively.
The weakness is autonomy. Elastic's root cause analysis requires more manual correlation than Dynatrace or even Datadog. You need to know where to look; the platform will surface anomalies but won't always connect them across service boundaries without some investigation. The learning curve for configuring custom ML jobs is steeper than competitors. If you do not already have Elasticsearch deployed, building out the ELK Stack purely for anomaly detection is operationally expensive.
New Relic Applied Intelligence
New Relic's anomaly detection is baked into Applied Intelligence, which ships across all paid tiers. The platform's Lookout feature automatically highlights abnormal metrics on service entities - basically surfacing anomalies before you even navigate to them. Issue Maps provide an entity relationship visualization that correlates related anomalies into a single incident view rather than flooding you with individual alerts.
The setup story is the best in this comparison. Enabling anomaly detection in New Relic is genuinely a "few clicks" operation. With 780+ integrations including a comprehensive Telemetry SDK for custom metrics, New Relic covers a wide surface area without the configuration overhead of Elastic or the cost weight of Dynatrace.
Pricing is transparent and tiered. The free tier includes 100 GB/month of data ingest, one full platform user, and access to all 50+ platform capabilities including anomaly detection - with no credit card required and no time limit. The Standard tier adds 30-day data retention and advanced analytics. Full platform users run $99/month in Standard, with Pro and Enterprise tiers for larger teams.
The limitation compared to Dynatrace is autonomy in root cause analysis. New Relic correlates incidents and provides entity relationship context, but the causal AI that Dynatrace runs automatically requires more manual investigation on New Relic. For teams with smaller engineering headcount who need to get anomaly detection running quickly without deep platform expertise, New Relic is the most accessible option.
Anodot
Anodot occupies a distinct category from the other four tools. While Dynatrace, Datadog, Elastic, and New Relic are primarily infrastructure and application observability platforms that include anomaly detection, Anodot is built specifically for business metric monitoring. Revenue anomalies, advertising spend spikes, user engagement drops, partner metric deviations - Anodot is designed for these use cases first.
The technical approach is unsupervised ML that analyzes 100% of your metric streams in real time. Anodot groups correlated anomalies across dimensions - identifying, for example, that a drop in conversion rate, a spike in payment errors, and unusual session lengths all started at the same time and are likely related. The multivariate correlation engine is truly sophisticated for business analytics workloads.
Integration coverage is broader on the business side: Salesforce, Kafka, REST APIs, SQL databases, and AWS S3. For data-intensive industries (adtech, fintech, gaming, telecommunications, e-commerce), Anodot's pre-built connectors cover the most common metric sources.
Pricing is fully custom with no published rates. Expect a discovery call before you see a number. User reviews on G2 and Capterra flag alert volume tuning as a time investment - the ML needs calibration to reduce false positive rates on noisy metric streams.
If your anomaly detection problem is primarily infrastructure and SRE, Anodot isn't the right fit. If you are monitoring business KPIs at scale and need an autonomous system that'll flag anomalies in revenue or cost metrics without manual threshold maintenance, it's the strongest purpose-built option.
Comparison Table
| Tool | Primary Use Case | Detection Approach | Free Tier | Pricing |
|---|---|---|---|---|
| Dynatrace Davis AI | Infrastructure/SRE | Causal AI + topology | 15-day trial, 3 hosts free | From ~$0.08/hr per 8 GiB host |
| Datadog Watchdog | Full-stack DevOps | ML baseline (2-6 weeks) | None | From $15/host/month infra, $31 APM |
| Elastic Observability | Logs/metrics/APM | 100+ preconfigured ML jobs | OSS only | From $125/month (Platinum) |
| New Relic Applied Intelligence | Full-stack + custom | ML ensemble + correlations | 100 GB/month perpetual | $99/user/month (Standard) |
| Anodot | Business metrics/KPIs | Unsupervised ML multivariate | None (free trial) | Custom quote only |
One Important Note on Azure Anomaly Detector
If you currently use Azure AI Anomaly Detector, plan your migration now. Microsoft announced the service will be retired on October 1, 2026. Existing resources continue operating until then, but no new resources can be created. Microsoft recommends migrating to Microsoft Fabric (which integrates the open-source microsoft/anomaly-detector library) or to Azure Data Explorer, which has integrated the Univariate Anomaly Detector API natively. If you are evaluating tools specifically to replace Azure Anomaly Detector, New Relic or Elastic are the closest managed alternatives for operational model.
Setup Complexity Reality Check
Vendor documentation consistently underestimates setup time. Here is what I actually see in practice:
- Dynatrace: Install the OneAgent and Smartscape builds your topology automatically. Outlier detection is on by default. Low hands-on time, but understanding Davis alert explanations requires ramp-up.
- Datadog Watchdog: Enable in UI - done. The two-to-six week training period is real; don't assess detection quality before six weeks of baseline data.
- Elastic: Straightforward for teams with ELK Stack experience. If you are new to Elasticsearch, add two to four weeks of infrastructure setup before you reach anomaly detection.
- New Relic: Fastest setup of the five. The Lookout feature starts surfacing anomalies in the first session. Most teams are operational in under a day.
- Anodot: Requires a sales process and onboarding session. Business metric integration varies by source. Time-to-value is hours to days for simple setups, longer for complex data pipelines.
Which Tool to Pick
For more context on how these platforms relate to broader observability infrastructure, see our best AI observability tools roundup and the best AI log analysis tools comparison.
Pick Dynatrace if you're running complex microservices or cloud-native infrastructure and need causal root cause analysis that works automatically. The cost is real but so is the engineering time it saves.
Pick Datadog Watchdog if your team is already in the Datadog ecosystem. The anomaly detection is solid and the integration breadth is best-in-class. Do not adopt Datadog purely for anomaly detection.
Pick Elastic if you already run ELK Stack and want ML anomaly detection layered on top of your existing log and metrics infrastructure. The 100+ preconfigured jobs are genuinely useful.
Pick New Relic if you're a smaller team, have a limited budget, or need to get anomaly detection running quickly. The free tier is the most generous in the category and the setup is the fastest.
Pick Anodot if your primary anomaly detection problem is business metrics rather than infrastructure. It's the only purpose-built business monitoring platform in this comparison.
If you also need vulnerability and threat detection as part of your security posture, the AI cybersecurity tools and AI security scanning tools roundups cover that adjacent space.
Sources
- Dynatrace Anomaly Detection Documentation
- Dynatrace Davis AI Overview
- Datadog Watchdog Anomaly Detection
- Datadog Pricing
- Elastic Observability AIOps Features
- Elastic Subscription Plans
- New Relic Pricing - Official
- New Relic Anomaly Detection Cost Analysis - SigNoz
- Anodot - Top 8 AI Anomaly Detection Tools
- Azure Anomaly Detector Retirement - Microsoft
- 9 Monitoring Tools with AI-Native Anomaly Detection - Last9
- AI Anomaly Detection Guide for DevOps/SRE 2026 - OpenObserve
✓ Last verified April 25, 2026
