Karpathy Scores Every US Job for AI Exposure
Andrej Karpathy scored 342 US occupations on a 0-10 AI exposure scale using BLS data - 42% of jobs score 7+, representing 59.9 million workers and $3.7 trillion in wages. He then deleted the GitHub repo.
Andrej Karpathy - OpenAI co-founder, former Tesla AI director, and one of the most respected voices in deep learning - quietly published a study scoring every occupation in the US economy for AI exposure. Then he deleted the GitHub repository. The website remains live. The data remains brutal.
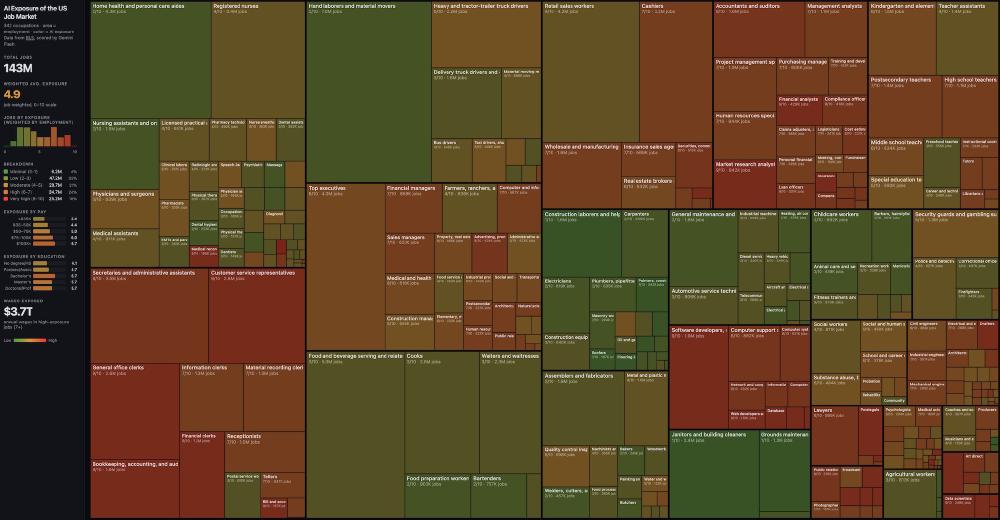
The study covers 342 occupations drawn from Bureau of Labor Statistics data, representing 143 million total US jobs. Each job received an AI exposure score from 0 (no exposure) to 10 (fully automatable by current LLMs). The weighted average across all jobs: 4.9 out of 10.
The pattern is simple: if you work behind a screen, AI is coming for your job. If you work with your hands, you're largely safe.
The Numbers
| Metric | Value |
|---|---|
| Occupations scored | 342 |
| Total US jobs analyzed | 143 million |
| Weighted average exposure | 4.9 / 10 |
| Jobs scoring 7+ (high exposure) | 59.9 million (42%) |
| Annual wages in high-exposure jobs | $3.7 trillion |
Most Exposed Jobs
| Occupation | AI Exposure Score | Employment |
|---|---|---|
| Medical transcriptionists | 10 / 10 | ~53K |
| Bookkeeping, accounting, auditing clerks | 9 / 10 | 1.6M |
| Accountants and auditors | 9 / 10 | 1.5M |
| Financial analysts | 9 / 10 | ~350K |
| Lawyers | 9 / 10 | ~800K |
| Software developers | 8-9 / 10 | ~1.8M |
| Management analysts | 9 / 10 | ~1M |
| Customer service representatives | 8 / 10 | 2.8M |
| Secretaries and administrative assistants | 8 / 10 | 3.3M |
| General office clerks | 8 / 10 | 2.6M |
Least Exposed Jobs
| Occupation | AI Exposure Score | Employment |
|---|---|---|
| Roofers | 0 / 10 | ~160K |
| Janitors and building cleaners | 1 / 10 | 2.4M |
| Construction laborers | 1 / 10 | 1.6M |
| Carpenters | 2 / 10 | ~1M |
| Plumbers, pipefitters | 2 / 10 | ~500K |
| Electricians | 2 / 10 | ~750K |
| Home health and personal care aides | 1 / 10 | 3.8M |
| Hand laborers and material movers | 1 / 10 | ~3.2M |
| Heavy and tractor-trailer truck drivers | 1 / 10 | ~2M |
| Farmers, ranchers | 2 / 10 | ~4M |
The Education Paradox
The data shows a correlation that inverts conventional career advice: higher education means more AI exposure, not less.
| Education Level | Average AI Exposure |
|---|---|
| No degree required | 2.7 |
| Professional degree | 4.7 |
| Associate's degree | 5.4 |
| Bachelor's degree | 5.7 |
| Master's degree | 5.7 |
| Doctoral degree | 5.7 |
The same pattern holds for salary. Jobs paying $100K+ average an exposure score of 6.0. Jobs paying $30-50K average 4.6. Jobs paying under $30K average 3.4. The occupations that took the most education and command the highest salaries are the ones most vulnerable to LLM-driven automation.
This doesn't mean a roofer's job is "better" than a lawyer's. It means the traditional logic - invest in education to protect your career from automation - no longer holds in an era where AI is better at manipulating information than manipulating physical objects.
The Methodology
Karpathy scraped occupational data from the BLS Occupational Outlook Handbook and used an LLM to assess each job's automation potential on the 0-10 scale. The visualization is a treemap where block size represents employment volume and color represents exposure level (green = low, red = high).
The approach is transparent about its limitations: an LLM scoring jobs for LLM replaceability introduces obvious self-referential bias. The scores reflect what current LLMs can theoretically do, not what employers are actually building. The gap between "AI can do this" and "AI is doing this" remains wide for most occupations.
But the directional signal is clear. Jobs that consist mostly of processing, generating, or transforming text, data, and code score high. Jobs that require physical presence, manual dexterity, or unpredictable real-world navigation score low.
Why He Deleted It
Karpathy published the analysis on March 15, 2026, including both the interactive treemap at karpathy.ai/jobs and the source code on GitHub at karpathy/jobs. Within hours, the GitHub repository was deleted - returning a 404 - while the website remained live.
He did not publicly explain the deletion. The most likely reason is the reaction: the study immediately went viral, with Elon Musk responding that "all jobs will be optional" and predicting "universal high income." That kind of amplification - from a study that uses an LLM to score automation risk, not peer-reviewed labor economics - may have made Karpathy uncomfortable with how definitively his exploratory analysis was being cited.
The deletion of the repo while leaving the website live suggests he wanted to slow the spread of the raw data and code (which others could fork and redistribute with modifications) while keeping his own controlled presentation available.
What It Does Not Tell You
Exposure is not displacement. A job scoring 8/10 doesn't mean 80% of those workers will lose their jobs. It means 80% of the task content could theoretically be performed by current LLMs. In practice, organizational inertia, regulatory requirements, client trust, and the need for human judgment slow actual adoption dramatically.
The scores are LLM-generated. Using GPT to score how replaceable jobs are by GPT is methodologically circular. Karpathy was transparent about this, but the viral spread stripped that caveat away.
Physical jobs have their own automation risks. Robotics, autonomous vehicles, and warehouse automation threaten many low-scoring occupations through completely different technology pathways. The 0/10 score for truck drivers, for example, ignores the autonomous vehicle industry.
The $3.7 trillion figure is misleading without context. It represents total annual wages of workers in high-exposure jobs, not money that'll be "lost." Most of those workers will adapt, retrain, or see their jobs evolve rather than disappear.
Karpathy's analysis is a visualization exercise, not a prediction. He used BLS data and an LLM to paint a picture of where AI capability overlaps with current job descriptions. The picture is striking: $3.7 trillion in wages, 59.9 million workers, a clean split between screen work and physical work. But the most important number might be the one he didn't include - the adoption rate. The gap between what AI can do and what organizations actually deploy it to do is where every one of those 143 million jobs actually lives.
Sources:

